This post was written by William Bratches, Lead, Senior Software Engineer at InRhythm.
Performance. Accessibility. Offline capability. Search engine optimization (SEO). These are advanced concepts whose analysis has been traditionally dependent on the grizzled experience of a team’s most senior engineers.
Except now there’s a tool to do it automatically.

Enter Lighthouse. It’s an open-source project from Google to assess webpage quality that will have a tremendous impact on your workflow. Available via Chrome, the CLI (Command-Line Interface), or npm, it can even be inserted into an existing automated testing suite. And it’s just dang cool.
Lighthouse in Action
Using Chrome? You can use Lighthouse to analyze this very page. Open up the developer console with command + shift + c. You can also right click and select Inspect to open the Chrome console. and navigate to the Audits tab; you’ll be greeted with Lighthouse logo:
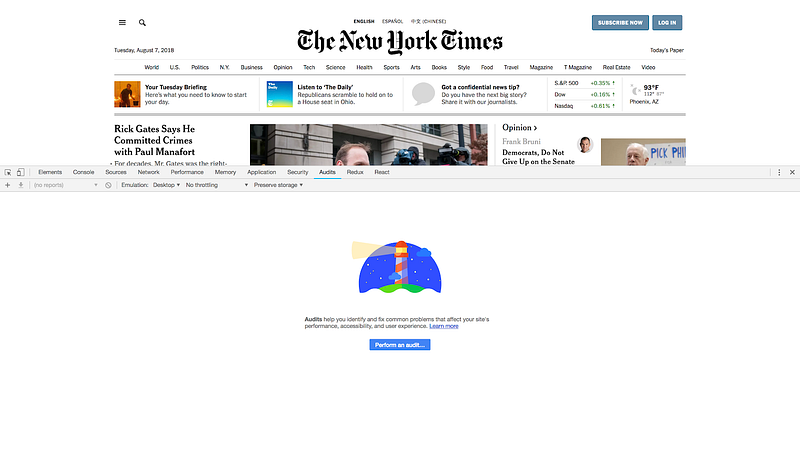
Note the ability to simulate a device to perform at the top of the console. Click the shiny blue “Perform an audit…” button, then leave all options selected. Click Run audit. It’s that easy — just wait a minute or two for the audit to complete.
Right away, Lighthouse shows us some important facts to remind us whywe’re doing a performance audit. Many of these facts are eye-opening:
- 19 seconds is the average time a mobile web page takes to load on a 3G connection (yikes)
- 75% of global mobile users in 2016 were on 2G or 3G.
- The average user device costs less than 200 USD
- The BBC has seen a loss of 10% of their users for every extra second of page load.
- Walmart saw a 1% increase in revenue for every 100ms improvement in page load.
Remember these the next time a designer wants you to put a 4k wallpaper above the fold.
Making Sense of Lighthouse
Lighthouse will give you a categorical breakdown of its findings. Let’s check out what some of then look like.
Lighthouse will analyze our site for Performance, SEO, Accessibility, Progressive Web App, and Best Practices. A detailed breakdown of these categories can be found in the documentation — for now, we’ll just look at performance.
For each category, Lighthouse will break down bottlenecks and milestones for a site. Here, it flags long load time for the New York Times website. Great, you might say — but there’s been a gazillion performance/accessibility/SEO tools since forever. What makes Lighthouse different?

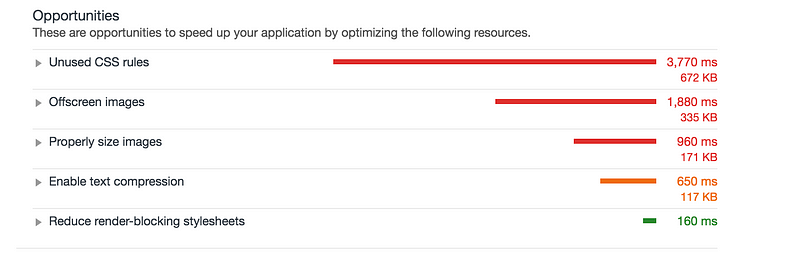
Lighthouse actually shows how to improve these metrics! In the “Opportunities” section, specific problems are pinpointed. This makes it easy to know what the next steps are for improving optimization.
Continuous Integration (CI)
Want a build to fail if it doesn’t meet accessibility requirements? Want to point the finger at Bob because he removed code minification and doubled the page load time?
That’s right. Lighthouse is incredibly versatile and is available outside the context of Chrome. It’s available as an npm package and can thus be integrated programmatically in a CI pipeline — or anywhere, really.
If you’re using Travis CI, there’s an open-source project to making CI integration easy as pie. You can drop it in the `package.json` and then execute it in Travis:
“scripts”: {
“lh”: “lighthouse-ci”
}
install:
— npm install # make sure to install the deps when Travis runs.
after_success:
— ./deploy.sh # TODO(you): deploy the PR changes to your staging server.
— npm run lh — https://staging.example.com
As Lighthouse’s popularity spreads, we hope to see more integrations in the future. Given its availability in NodeJS, there’s nothing stopping an engineer from undertaking integrations with other popular CI frameworks.
This was a quick introduction, but I highly recommend you try the tool for yourself and gain new insights into popular sites you visit. The comprehensiveness of the reports is impressive, and is bound to teach anyone a thing or two.

Leave a Reply